Opening Anecdote
During the summer of 2009, my wife and I had the opportunity to climb more than a dozen peaks, mostly in our home state of Montana. After summiting the lesser-known and almost untrafficked second-highest peak in Montana, we had a conversation on the trail regarding the accuracy of reported peak elevations, especially those reported on USGS topographic maps. The western “summit” of Mount Wood is reported as being 12649 feet above sea level and is “reported” as the summit on the current USGS topo. Numerous climbers (Thomas Turiano, a few climbers posting here on summitpost, etc.) have noted that the eastern summit appears to be higher and have tested that hypothesis with homemade levels, etc. Out of curiosity, we attained both summits that day and took very rudimentary elevation readings with a consumer grade GPS unit. The summits did differ in elevation by about 10 feet, with the eastern summit being higher. Thus, in my opinion, the true summit of Mount Wood is the eastern one (~12660ft), not the western one as currently noted on current USGS topographic maps.
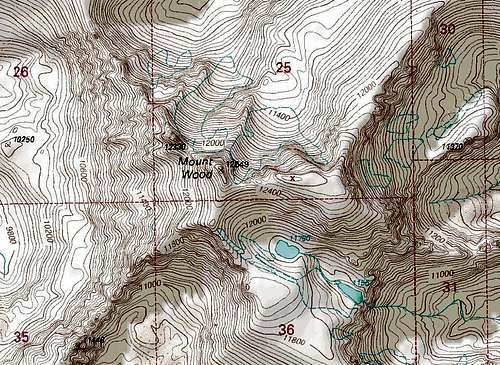
![Wood Topo]() The most current USGS topo of the Mount Wood area (a 1996 USFS edited version of the 1986 UGSG map), with the eastern summit noted by a red x.
The most current USGS topo of the Mount Wood area (a 1996 USFS edited version of the 1986 UGSG map), with the eastern summit noted by a red x.It should be noted that there are no benchmarks on either of Wood's summits, but it has been surveyed at least once (from the western summit), in 1898 during a survey/mapping expedition led by James Kimball (Turiano 2003), under the USGS. Its elevation was obtained from vertical angles calculated from other nearby peaks or benchmarks (an aneroid barometer was also used in 1898, and estimated Wood's western summit at 12489 ft, 160 ft shy of the more accurate, vertical angle estimates). So why did the surveyors choose the western, lower summit? (Turiano hypothesizes the more dramatic western summit made for “an easier survey target” and thus received “summit” status.)
And then came a whole slew of additional questions:
- What other sorts of “errors” exist in summit elevations or locations?
- How many other summits are actually higher than the elevations noted on topo maps, especially when benchmarks are not in place on the summits?
- And just how accurate are some of these elevations, many of which were calculated decades ago, well before the technological advances we see today with high-precision GPS survey units?
- Why haven't many summits been resurveyed with modern equipment (or maps updated accordingly if they have)?
These questions and more lead me on a trek to discover what peak elevations listed on topographic maps are all about. I quickly realized that benchmarks we often see on the landscape (and on summits) are an integral part of the system used to measure elevation and offer a rich and tangible history to the measurement of summit elevations. The following is the result of that inquisitive meandering.
A Brief History and Purpose of Modern benchmarks in the United States: A Tale of Two Agencies
A benchmark is simply a reference point
![Dixie Butte Benchmark (OR)]() Modern bench mark examples: Dixie Butte, OR
Modern bench mark examples: Dixie Butte, ORon a stationary object for which the geographic location (and usually elevation) is known, marked in some fashion to permit a surveyor to return to a location or create a new known location with a high degree of confidence. These known points are then used for surveying property boundaries, constructing buildings/roads, or making maps. A modern benchmark is almost exclusively marked with a survey disk, which has been commonly used for over a century; however, benchmarks of the past were denoted with a wide array of markings, including shapes chiseled in stone, cairns, copper posts or nails, or even earthenware pots. For hundreds of years, a wide variety of agencies and organizations have placed benchmarks on the globe. Let me introduce two federal agencies that are two of the most prolific sources of benchmarks in the US.
The First Source
The first source you've probably heard of - the United States Geological Survey (USGS).
![Boundary Peak, NV]() Boundary Peak, NV
Boundary Peak, NVThe USGS is part of the Department of the Interior, which also directs the National Park Service, Bureau of Land Management, United
![Longs Peak Summit Marker]() Longs Peak, CO
Longs Peak, COStates Fish and Wildlife Service and Bureau of Reclamation . Under the broad mission of “providing reliable scientific information to describe and understand the Earth,” the USGS has numerous and diverse responsibilities, ranging from seismic monitoring to wildlife disease research, natural disaster hazard delineation to water quality/stream flow monitoring.
However, in the world of outdoor recreation, the USGS is perhaps best known for its production of the ubiquitous topographic map. This intensive, high quality mapping effort began in 1879, immediately after the USGS was established, but was limited to areas of geologic importance (e.g. mining districts). Previous topographic maps had been made by the Corps of Topographic Engineers, but were limited in quality and scope. The initial USGS mapping effort was expanded to a nationwide survey effort in 1882 (under the direction of John Wesley Powell) to provide a topographic base map for a geologic map of the United States. It took over 100 years to complete the primary base series. Permanent benchmarks (in the form of survey disks) were used as early as 1898 and greatly enhanced the value of topographic mapping efforts – the elevations of specific locations were precisely known and marked for future reference.
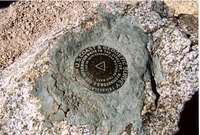
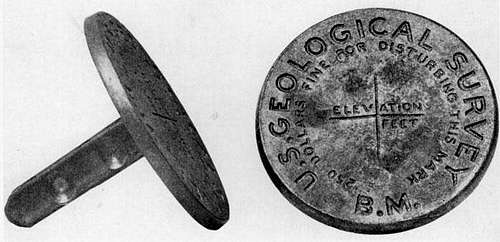
![USGS disk]() One of the first USGS survey disks source
One of the first USGS survey disks source
From the earliest surveys on through the 21st century, the USGS has placed tens of thousands of benchmarks. However, most of the records of these benchmarks were never digitized and the exact number of benchmarks placed by the USGS is unknown. For those interested in the infamous King, Hayden, Powell and Wheeler geologic surveys from 1868-1879 under the Interior Department and the War Department - start here and here. No modern benchmarks were placed during these surveys.
The Second Source
The second major source of benchmarks is not as well known by the general public - the National Geodetic Survey (NGS). The NGS currently operates under the National Oceanic and Atmospheric Administration within the Department of Commerce. Its primary focus is the management of the National Spatial Reference System (NSRS), but it is responsible for other tasks such as management of the Continuously Operating Reference Stations (CORS) Network used in GPS survey standardization, national shoreline delineation, survey method improvement, and geoscience research. As the agency in charge of the NSRS, the NGS is responsible for: 1) maintaining and updating benchmark locations, elevations, and records and 2) calculating the vertical and horizontal datums which are tied to the NSRS; thus, it is the authority on such matters.
The NGS started surveying in 1816 as the Survey of the Coast, an agency created to make nautical charts along the Eastern seaboard of the US to reduce the number of shipwrecks that were impacting interstate commerce (hence why the Federal Government jumped in). This initial effort was short-lived but was reborn in 1933 as the US Coastal Survey. The Coastal Survey went on to produce its first nautical chart in 1839 and eventually mapped many harbors and coastlines from New Orleans to New England. However, these maps were not continuous or tied together with common benchmarks, so in the late 1840s, the Coastal Survey embarked on its first major continental survey with the triangulation of the Eastern Oblique Arc from Calais, Maine to New Orleans, Louisiana. The goal of the Eastern Oblique Arc was “to tie together the multitude of coastal and harbor surveys into a uniform network,” establishing locations and datum to base additional land surveys. [Side note: The earliest significant mountain surveyed appears to be Mt. Washington in New Hampshire as part of the Eastern Oblique Arc, which was monumented in 1849.]
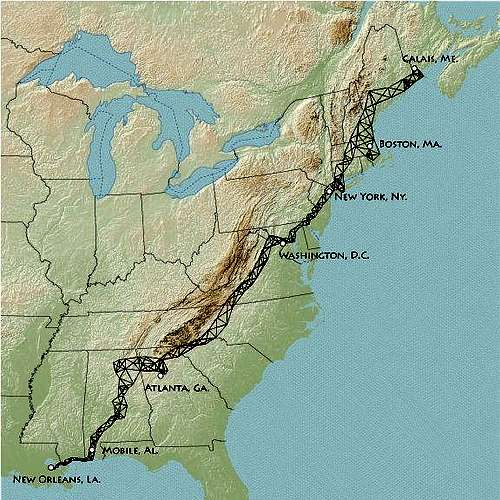
![eastern arc]() The Eastern Oblique Arc source
The Eastern Oblique Arc source
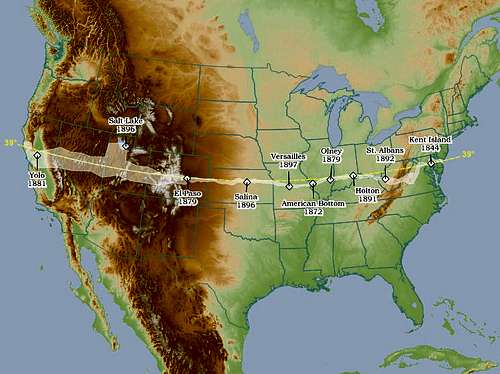
In 1871, building on the success of the Eastern Oblique Arc (with surveying still in progress), the Coastal Survey was authorized by Congress to survey the first Transcontinental Arc along the 39th parallel to the West Coast, which was completed in 1896. During that time (1878), the Coastal Survey was renamed the US Coast and Geodetic Survey (USCGS), a more fitting name since the agency was now conducting surveys across the entire country. In 1900, the USCGS started placing its first survey disks, concurrent with their use by the USGS (primary source for information in the last two paragraphs, unless overwise noted – warning: ~14MB ppt file).
![trans_arc]() The first Transcontinental Arc source
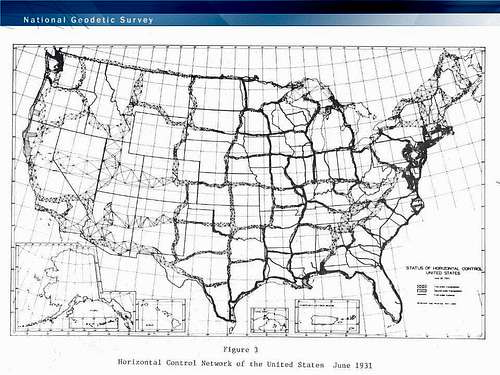
The first Transcontinental Arc source![1931net]() 1931 Horizontal Control Network (see primary source above)
1931 Horizontal Control Network (see primary source above)
The first Transcontinental Arc ended up being the start of a nationwide network, laying the groundwork for the National Spatial Reference System (NSRS), which spanned the country from coast to coast and border to border by 1931. The NSRS was the first uniform coordinate system for the country and was later developed into the continental systems used today – e.g. NAD 27, NAD 83. This system was then managed by the USCGS until 1970, when it was restructured (split) into oceanic and geodesy survey units, creating the current National Geodetic Survey. Today, there are over 1,500,000 positioned points in the NSRS.
Interestingly, the initial transcontinental surveys completed by the NGS in the early 1870s did not result in highly accurate elevation (vertical) data, only horizontal data. This was due to the trigonometric measurements of vertical angles with inchoate equipment. To create an accurate vertical network, new methods were devised for use in the first Transcontinental Leveling survey which began in 1877 and followed the route established during the Transcontinental Arc along the 39th parallel. [However, these methods were time-consuming and the survey levels were sensitive to numerous stressors (reducing accuracy), and they were replaced with a superior technique and equipment in 1900.] Despite potential errors, these data were used in 1900, along with data from the USGS and a few other sources, to create the “First General Adjustment” of all geodetic leveling in the US, essentially the first vertical datum that accurately classified elevations. Continued leveling surveys resulted in further, improved revisions in 1903, 1907, 1912, and 1929. The last adjustment (1929) covered a total of 66,300 miles of survey and 26 tide gauges in both the US and Canada and resulted in a continental vertical datum: NGVD 29. This datum was then used for over 50 years (which overlaps with major topographic mapping efforts by the USGS), even though its precision was questioned (see last page of text). In 1988 a new, more accurate vertical datum (NAVD 88) was calculated. NAVD 88 is the official vertical datum for the United States, against which federal agencies measure elevations.
The Link Between the Two
So, how do the histories of these two agencies tie together?
![plane]() A USGS Planetable and Alidade source
A USGS Planetable and Alidade sourceFirst, the predecessor agencies of the NGS established and maintained a complex system of benchmarks throughout the US, which were then used by the USGS as part of its nationwide mapping effort:
“The U.S. Geological Survey has always looked to the U.S. Coast and Geodetic Survey [now NGS] for primary horizontal and vertical control and, during many years, has maintained cordial and effective cooperation.”(page 11)
The USGS frequently used measurements from NGS benchmarks as a reference, and also adopted and adapted survey techniques, such as baseline measurement, and materials and equipment, such as the planetable, from the National Geodetic Survey (see adjacent figures for examples).
Second, despite the “cordial and effective” relationship implied in the quotation above, the agencies were actually competitive with each other for years. When the USGS was created in 1879, its mapping authority was limited to the western 2/3 of the US and the USCGS started to make maps on the Eastern US (page 6). At one point in 1884, the Coast and Geodetic Survey was almost given given exclusive direction by Congress to create topographic maps throughout the US (page 29), but this did not come to fruition and the USGS retained topographic map making authority. This did not eliminate all conflict however. The USCGS kept a small number of map makers to publish various maps of its work and the agency aspired to make topographic maps. In 1946 the USCGS was encouraged, by the Bureau of the Budget, to map the interior of Alaska (it had already mapped the coastlines) and produce topographic maps. This directly conflicted with the mission of the USGS, and when the issue was resolved, the USCGS ended up producing all the 7.5' topographic maps touching coastal waters, while the USGS completed the rest (page 104). This appears to be one of the few times when the USGCS made topographic maps, however.
Thus, through cooperation and competition, these agencies have been influential on each other and have forced each other to achieve important improvements in their techniques and products. It has also created two unique niches for these agencies to occupy. The USGS is the sole agency responsible for drafting topographic maps, while the NGS is the sole agency in charge of determining the true locations and elevations of the US through the development of horizontal and vertical datums. This is important to note as we move forward in this exploration of summit elevations and their accuracy.
How is it Done? The Techniques of Surveying
![leveling]() Differential Leveling Technique source
Differential Leveling Technique sourceSorry to lead anyone on with this section, but I will not attempt to summarize anything here, as numerous other sources have successfully explained survey methods in an accessible and far more complete manner than I could ever achieve here. I suggest those interested in the details start by examining the information within the resources listed below:
Basic surveying by Walter S. Whyte, R. E. Paul.
Topographic surveying by American Society of Civil Engineers.
Wikipedia
Is it a benchmark? Other Survey Marks on the Landscape
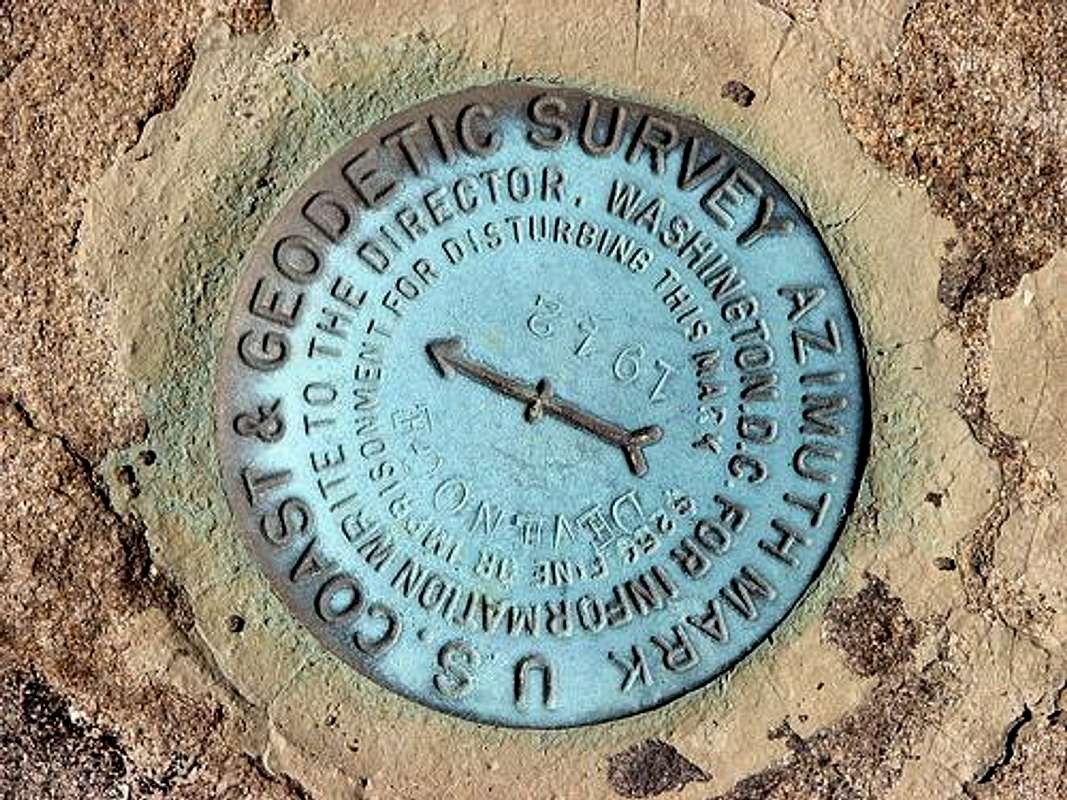
There are other permanent, survey disks on the landscape that look like benchmarks. They are imposters. Generally, they fall into three categories: reference, azimuth, and cadastral marks. Reference marks are set near a triangulation station (e.g. benchmark), with accurate direction and distance information to the triangulation station so it may be re-set if necessary. They are usually seen in sets of 2s, 3s, or occasionally more and have arrows in their centers (as opposed to a cross or triangle - see below). Azimuth marks provide accurate azimuth (like a compass direction) that is based on true North for a triangulation station. Azimuth marks are also denoted by arrows in the center of the mark. Cadastral marks are used to denote property boundaries, such as section corners, and may have a variety of symbols at their center. Generally speaking, none of these marks provide any sort of vertical (elevation) or horizontal control information on their own (and thus are not benchmarks), but in the cases of reference and azimuth marks, are almost always associated with a nearby triangulation station. Look here for a complete list of mark types used by the NGS over the last 200 years. [Also look here for an extensive album of marks posted here on summitpost.] The bottom line: don't confuse these marks with benchmarks.
![Castle]() This is a bench mark (Castle Mountain , MT)
This is a bench mark (Castle Mountain , MT)
![azimuth]() This is an azimuth mark (Lake DeVenoge, NY)
This is an azimuth mark (Lake DeVenoge, NY)
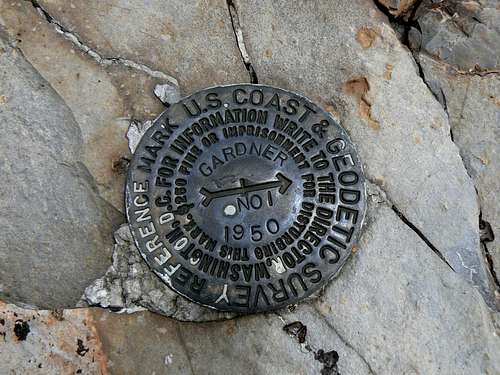
![gardner]() This is a reference mark (Gardner Mountain, WA)
This is a reference mark (Gardner Mountain, WA)
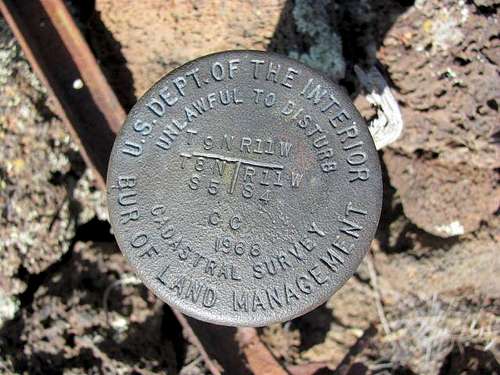
![cadastral mark]() This is a cadastral mark (El Mapais, NM)
This is a cadastral mark (El Mapais, NM)
A Mountaineer's Perspective (One Among Many)
So, when I started this journey, one question stood out above the rest: What is a summit's true elevation? Essentially, this is the distance (in whatever units you prefer) between a summit's highest point and the reference surface, which was previously linked to mean sea level. The most recent vertical datum (NAVD 88) is actually only tied to a single measurement of sea level (at the mouth of the St. Lawrence River) and modern reference surfaces estimate mean ocean surface based on gravitational measurements. Going back to determining elevation, the reference was first established (e.g. NAVD 88), then the summit was measured against that reference. Simple enough? But there's another part to this question. Can a summit have a true elevation? Isn't an elevation inevitably tied to the reference surface and how that is calculated/estimated? Yes, absolutely. For instance, if the sea level reference station for the NAVD 88 datum were selected along the west coast, say at Seattle, WA, then most elevations throughout the western US would be 2-3 ft lower in elevation than currently calculated by the NAVD 1988 datum. So, to a certain degree, the elevation of a summit is flexible, as sea level is not constant across the globe (sea-surface topography changes due to currents, climate, and gravitational forces). But these differences are quite small compared to other changes in elevation over time.
Elevations can change over time for a couple of reasons. First, subsequent surveys of a specific location may disagree do to inaccuracies in one survey or another. These are typically minor changes. Second, the reference surface may be adjusted after a large set of elevations are resurveyed across a region (or the reference location for sea level changed, as in the example above), which would change all the elevations in an area. These changes could be sizable, but not huge. Third, tectonic movements, substrate settling/deposition, or glacial rebound may change the actual, true elevation, whether on a broad scale or at a specific location. These elevation changes could be massive in some cases. For example, Mt. Borah in Idaho increased in elevation by about 7 ft during a 7.3 magnitude earthquake on October 28, 1983.
Okay, so that answer was a little vague, but to a certain degree, it depends on your perspective and how you define your reference surface. So, moving beyond the ambiguity of summit elevations, what about those original questions I asked in the opening section of this article:
What other sorts of “errors” exist in summit elevations or locations? How many other summits are actually higher than the elevations noted on topo maps, especially when benchmarks are not in place on the summits?
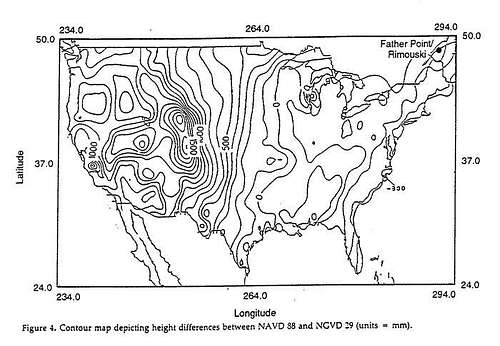
Pretty much all elevations on topographic maps are wrong, due to the fact that these maps and their respective benchmarks (placed to assist with mapping) were established prior to the switch to NAVD 88, a more accurate datum. So, all topographic map elevations are in NGVD 29 - and the USGS is not planning to update the 7.5-minute quadrangle map series from NGVD 29 to NAVD 88. Thus, elevations on topographic maps will be wrong for quite some time. It is relatively easy to find the most up-to-date elevation if the summit has a benchmark. When a benchmark was not placed on the summit, the following figure would offer an approximate adjustment to those points, although the effect summarized here may be amplified at higher elevations (and therefore it may be easier to look at the NGVD 29 to NAVD 88 adjustment at nearby benchmarks to estimate the elevations of summits without benchmarks).
![vertdiff]() Map of vertical adjustments (nationwide) from NGVD 29 to NAVD 88 in millimeters (Figure 4)
Map of vertical adjustments (nationwide) from NGVD 29 to NAVD 88 in millimeters (Figure 4)
In the western US, many summit elevations are as much as 10 ft higher than reported in most sources, including USGS topo maps (and frequently summitpost as well). Here are a few examples of new NAVD 88 (and old NGVD 29) elevations for select summits:
Borah Peak, ID - 12668 ft (12662 ft)
Gannett Peak, WY - 13,809 ft (13,804 ft)
Mt. Shasta, CA - 14,179 ft (14,162 ft)
Mt. Hood, OR - 11,249 ft (11,239 ft)
Mt. Wheeler, NM - 13,167 ft (13,161 ft)
Humpherys Peak, AZ 12,637 ft (12,633 ft)
Boundary Peak, NV - 13,147 ft (13,140 ft)
Mt, Rainier, WA - 14,416 ft (14,410 ft) - based on a 6 ft increase at the adjacent summit benchmark
Kings Peak, UT - 13,534 ft (13,528 ft) - based on a 6 ft increase on South Kings Peak benchmark
Some have caught this change to a new vertical datum, as reflecting in these examples where the summit elevations are correctly reported on summitpost:
Mt. Whitney, CA - 14,505 ft
Mt. Elbert, CO - 14,440 ft (along with many other peaks in CO, especially the 14ers, which have the correct elevations in some publications)
Of course, elevations could change again if newer, more accurate elevation models (specifically reference surface models) are employed by the NGS, which could be a few years (or decades) down the road.
And just how accurate are some of these elevations, many of which were calculated decades ago, well before the technological advances we see today with high precision GPS survey units?
Surprisingly accurate in some cases, at least when compared to modern GPS measurements. I'll demonstrate this in an example in the next section. In fact, literature from the NGS suggests that traditional differential leveling techniques were actually more accurate than GPS derived elevations.
Why haven't many summits been resurveyed with modern equipment (or maps updated accordingly if they have)?
It's expensive to acquire and haul modern survey equipment into remote locations. Furthermore, a re-survey would probably only result in marginal changes (since other leveling techniques were so accurate). A slightly more accurate survey is of little economic importance in the mountains, compared to a benchmark in the downtown area of a large municipality where a new bridge is being constructed. The original heights of summits and distinct features in rural areas were measured to assist with USGS mapping more than anything else, certainly not for climbing to exact elevations.
This brings me to a final question: Does it really matter in the end how high a peak is? This is obviously delving into the realm of the philosophy of climbing, but I'll take two stabs at it:
Yes, it's important to know the elevations of your objective(s). For one, you are able to quantify your achievement in some way and compare it to other climbs, mountains, or your friends achievements, much like our climbing grade/class systems (YDS, WI, etc.). Known elevations allow us to define goals and make peak/route lists, which pairs down an endless supply of summits into a limited, manageable group. Interestingly, this also concentrates use when lists are highly publicized or overlap, as I've seen first hand in Colorado. Summits slightly higher than 14,000 ft are often packed with recreationists, while those just under 14,000 ft are typically vacant. It also satisfies a seemingly basic human motivation to go higher and know if you are higher then you were at another location.
On the other hand: no, elevations are unimportant and a burden. They are arbitrary measures of the Earth, since the units of measure themselves are arbitrary, along with the milestones they create. What if everyone in Colorado climbed the 4000 meter peaks? There would be almost 550 of them... unless you limit yourself to those with 500 m of prominence (also arbitrary) – then only 55 remain. The pursuit of specific goals and chasing elevations takes some of the fun out of just being in the mountains. Is peakbagging to check a mountain off a list still climbing? Is the essence of climbing still present? Either way, elevations are relative measures and may be subject to multiple interpretations, particularly when it comes to the importance of specific elevations. Granted, elevations allow for objective comparison between summits (10,000 ft is higher than 9,999 ft), but do those objective measures really mean anything except what we want them to represent?
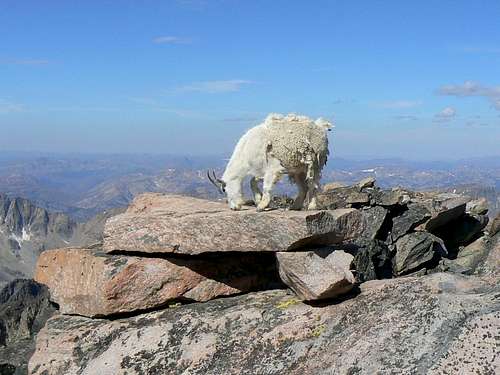
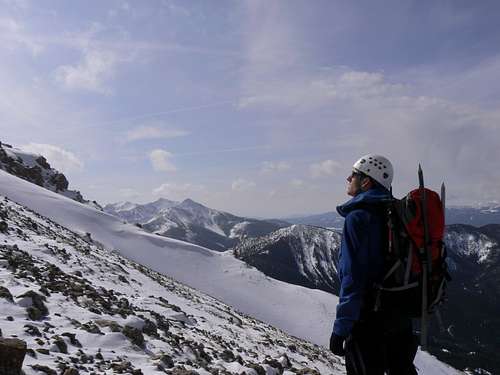
![granite goat]() Does this nanny goat on top of a state highpoint care that she's on top? Does the exact elevation matter to her?
Does this nanny goat on top of a state highpoint care that she's on top? Does the exact elevation matter to her?
Closing Anecdote
Another peak my wife and I
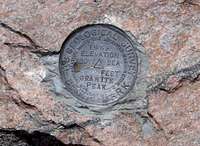
![granite bm]() The Granite Peak bench mark
The Granite Peak bench markwere fortunate enough to summit in the summer of 2009 was Granite Peak. This peak hosts a well-loved benchmark sought after by many climbers. It was placed in 1953 by the USGS, but does not have a specific elevation stamped on its surface (like many benchmarks), most likely because the elevation was unknown until after the survey of the immediate area was complete and elevations calculated (I guess the surveyors didn't feel like summiting a second time?). Perhaps this was for the better. Nearly every map I've seen has Granite's elevation listed as 12,799 ft. But is this correct? After my previous experience on Mount Wood, I was in doubt.
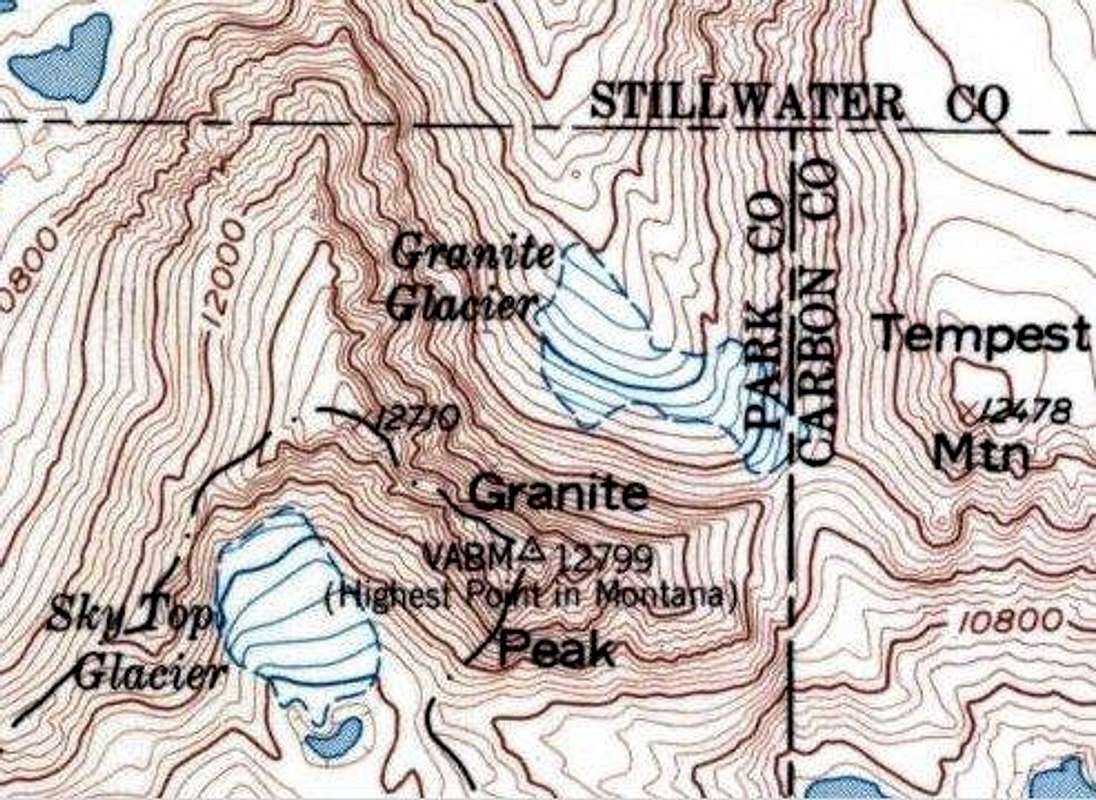
![granite old]() Granite Peak Map, 1956 (historic topo source)
Granite Peak Map, 1956 (historic topo source)
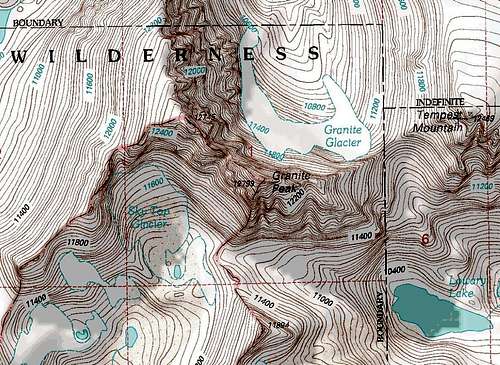
![granite]() Granite Peak Map, 1986
Granite Peak Map, 1986
And, as you may have guessed from reading this article, the elevation of 12,799 ft is not correct. In fact, when the 1953 benchmark was placed, the elevation was corrected to 12,801 ft (based on the survey). The original elevation of 12,799 ft was calculated in the 1920s, after a failed summit attempt by the Kimball party in 1898 (Turiano 2003). Then, after the adoption of the NAVD 1988 vertical datum, the height was adjusted again, to 12,807 ft. However, the topographic maps for the Granite Peak area were originally drawn in 1956 (Cooke City, 1:62,500) and later revised in 1986 (aptly named Granite Peak, 1:24,000). Both of these maps, 1956 and 1986, used the original elevation data of 12,799 ft, despite the known correction from 12,799 to 12,801 in 1953. This meant that every common publication, maps or otherwise, ended up referring to the incorrect elevation. And everyone who read those publications followed suit, from guide books (Turiano 2003) to climbing websites. To its credit, Wikipedia has the correct elevation for Granite Peak, but this is only a single step in the right direction of reporting the correct elevation.
Now, these elevation changes were made because a shift in the local reference elevation after the 1988 adjustment to the national vertical datum. But does that mean that the original elevation, calculated from measurements taken in 1953, was correct? What would the elevation be if the summit were surveyed with modern (GPS) equipment? Little did I know, but a group of intrepid surveyors set out for the Granite Peak summit in the summer of 2008, $12,000 of GPS survey equipment in hand. After a grueling approach and climb, 4 of the 7 member team made it to the summit, where they set up the GPS unit and acquired data for over two hours. The result of their efforts – an elevation reading of 12,807.09 ft, give or take about 0.5 ft (read the article to understand the details of why the accuracy could not be narrowed down to a more exact number). This reading did support the currently published elevation of 12,807 ft, which the NGS was excited to validate with modern equipment. And it seems to further the cause of using NGS data for our measurements of summit elevations.
Will we now be able to trust the NGS and the authoritative readings in their database, even if outdated maps indicate otherwise? We should, especially if the true elevation matters to some, if not a majority of climbers who take to the summits of our globe each year. And with that, I'll say, “Happy climbing everyone, to whatever elevation that may be.”
Epilogue
I may be going out on limb here claiming any expertise regarding bench
marks, as I'm sure a few folks have thought about them more than I have (and I may even have more than a few things wrong, so please let me know if I do). However, none have bothered to write about benchmarks in great detail as they relate to our passion for climbing (at least on summitpost) from what I can tell. Thanks for your interest.
Resources and Links
benchmark information
https://www.summitpost.org/album/184294/bench-marks.html
https://www.summitpost.org/album/592313/my-benchmarks.html
https://www.summitpost.org/album/615210/usgs-benchmarks.html
http://www.ngs.noaa.gov/cgi-bin/datasheet.prl
http://www.ngs.noaa.gov/web/about_ngs/history/Survey_Mark_Art.pdf
benchmark hunting
http://www.geocaching.com/mark/
http://www.holoscenes.com/cgi-bin/moin.cgi/Home
http://benchmarks.scaredycatfilms.com/ (benchmark search map)
http://forums.groundspeak.com/GC/index.php?showforum=10
http://forums.groundspeak.com/GC/index.php?showtopic=95774
Geodetic and leveling surveys
http://www.history.noaa.gov/tools/surveytech.html
http://www.ngs.noaa.gov/PUBS_LIB/Geodesy4Layman/toc.htm
http://www.ngs.noaa.gov/web/about_ngs/history/indexhNGS.shtml
http://www.ngs.noaa.gov/web/about_ngs/history/NGSvertical.shtml
http://www.geod.nrcan.gc.ca/edu/geod/survey/index_e.php
http://www.pobonline.com/Articles/Column/b798817cac0f6010VgnVCM100000f932a8c0____


Comments
Post a Comment