Vertical Ascent Rate

Tips, tricks, workouts, injury advice.
User Avatar
Day Hiker

 
Posts: 3156
Joined: Fri Dec 26, 2003 2:57 am
Thanked: 61 times in 43 posts

by Day Hiker » Sat Feb 27, 2010 9:18 pm

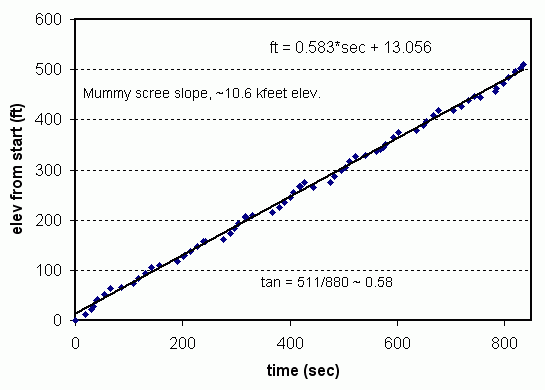
MoapaPk wrote:I'd like clarification on Ze's definition -- before I show plots for tan ~ 1.

From Ze's other link:

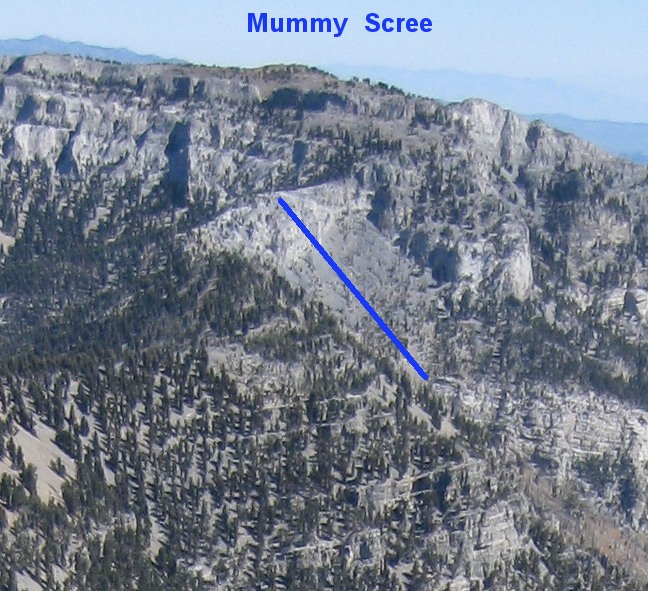
Ze wrote:The grade is defined as (vertical distance / horizontal distance) at any given moment.

Tangent, not sine.

User Avatar
MoapaPk

 
Posts: 7780
Joined: Fri May 13, 2005 7:42 pm
Thanked: 787 times in 519 posts

by MoapaPk » Sat Feb 27, 2010 10:38 pm

Day Hiker wrote:My point is NOT that there is a big difference between 18.8 and 18.5. My point is that you could determine for yourself that I was in fact using the correct definition (tangent) for the calculations. You had stated that you guessed I was using the wrong method:


Not that I consider it a "wrong" method -- just a different method. Maptech once used the sine method. My point was that when I saw "4," I assumed the difference between 18.5 and 18.8 was indistinguishable within the implicit precision (vs. the range 0f 3.5 to 4.5). My apologies if it seemed like I was poking at you. (Also, I should avail myself of the calculator, rather than doing these divisions in my head.)

Now that I know Ze's definition (thanks for the pointer to the previous post), I'll be consistent.

User Avatar
Ze

 
Posts: 336
Joined: Tue Oct 21, 2008 2:50 am
Thanked: 61 times in 33 posts

by Ze » Sun Feb 28, 2010 5:43 am

Of course there are multiple ways, but as long as its clear which way its defined, I think its ok.

However, I'm pretty sure (and the wiki links also says) that rise / run is clearly the most common definition of grade.

User Avatar
Ze

 
Posts: 336
Joined: Tue Oct 21, 2008 2:50 am
Thanked: 61 times in 33 posts

by Ze » Sun Feb 28, 2010 5:44 am

kevin trieu wrote:boy, way too much science. what happened to heading outside for a walk in the woods without worrying about how far, how fast, how efficient... :?


what a useless comment.

gotta love when people get all negative at people for liking to learn / explore things.

no avatar
The Chief

 
Thanked: time in post

by The Chief » Sun Feb 28, 2010 2:02 pm

Whatta ya suppose VAR on these would be....

Image
Image

User Avatar
graham

 
Posts: 477
Joined: Mon Aug 15, 2005 9:51 pm
Thanked: 10 times in 8 posts

by graham » Sun Feb 28, 2010 6:21 pm

boy, way too much science. what happened to heading outside for a walk in the woods without worrying about how far, how fast, how efficient... :?
Hmmm…. sounds like narc for the MLC SC :lol:

The Chief wrote:Whatta ya suppose VAR on these would be....
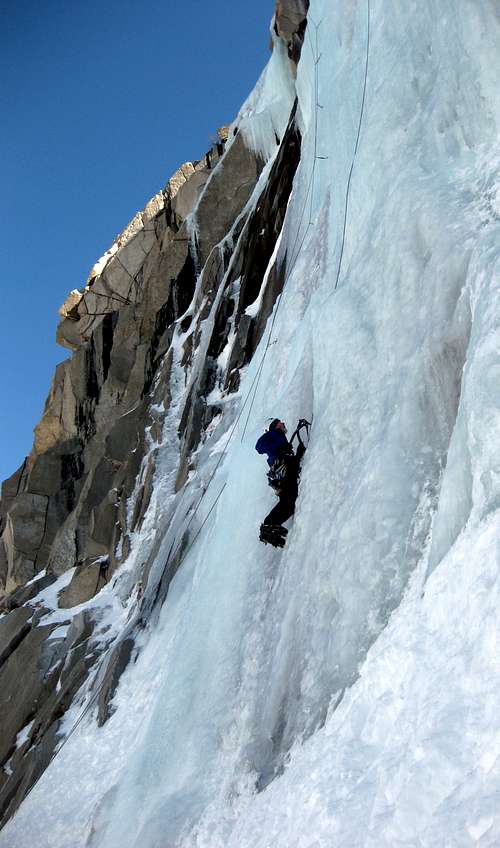
I don’t know, but probably not as speedy as these ice monkeys. Yeah yeah ….I know they’re TRing, but still pretty speedy
http://www.youtube.com/watch?v=fkmwfi21-n4

And here’s some serious VAR :shock:
http://www.youtube.com/watch?v=eWCljD5_Rew

Also, remember "slow is safe":lol: :lol:
http://www.youtube.com/watch?v=Qd8bHA53wko

User Avatar
MoapaPk

 
Posts: 7780
Joined: Fri May 13, 2005 7:42 pm
Thanked: 787 times in 519 posts

by MoapaPk » Sun Feb 28, 2010 9:42 pm

I started to look for a few places --near me--where the grade could be construed as fairly uniform for statistically useful samples, and came across some "gothchas." These two examples are NOT on trails, and both have some feature that prohibits normal walking. The first doesn't require hands, the 2nd does.

The first is the Mummy scree slope as shown below; it averages ~10.6 kfeet in elevation, so the O2 is ~72% of the sea level value; surely that has some effect.
Image

This pretty uniform, obnoxious scree lasts for a little bit over 500-550' vertical. Here's the distance/time plot:
Image
...so this is just one point on a Ze-type plot. The surges reflect periods when I gain ~50 vertical feet, then rest for 20 breaths or so. So one could come up with at least 9 periods when my rate far exceeded the average; but that would be misleading, as I never could have kept up that rate long. The regression line (which averages out all the surges and rests) gives ~0.58 ft/sec for a tangent of ~0.58, as determined from the start and end points of the slope. However, I tend to switchback naturally, and these tiny switchbacks are averaged out in the track recorded by the GPS, so the true grade is hard to define. Here, the average grade is nearly the gradient, as I usually want to get this miserable section over quickly; the scree makes obnoxious footing, with much slipping. What struck me was how uniform was the average. Furthermore, the ft/sec ascent rate on the slope, was roughly the same as my average ascent rate for all 3.8 kfeet of vertical rise to the top, even though most of it was on gentle switchbacked trails (the NLT and Trail Canyon to Charleston Peak).

I looked for a long uniform rock ramp, where I transitioned to scrambling, and the closest I came was this:
Image

The average elevation is ~3.0 kfeet, so altitude has no effect. However, it is a little hard to define the grade. The coarsely averaged gradient is ~1.0, but I generally wander across the ramp a bit to find a path, and there are short, near vertical bands of 3-5'. The rock is very stable and frictional, so you don't slip, but you have to stop and think where the next step should be. Hands are on the rock maybe 20% of the time. For the two trips shown below, the ascent averaged about 0.66 ft/sec (the regression doesn't go through 0, so obviously...) for a grade of ~0.89.
Image
For the pink symbols, I was alone, and the trip from car to summit took me about 60% of the time for the full trip that corresponds to the blue symbols; for the latter, I was with a group of 10 (the last ramp is just about 7% of the total elevation gain to the summit). Yet in both cases I got about the same average rate on this ramp. For the 1st trip, I was a little spent by the time I hit the ramp, and on the 2nd, I stopped to count the folks below me, to make sure all were in sight.

I guess what this tells me is that 1) the problem is not so easy to define once you are off a trail; and 2) I tend to regulate my own speed, like all sensible people who are not automatons, so my lungs don't burst and my legs don't go anaerobic, yet I am mindful of schedules.

(All point measurements via GPS-calibrated barometric altimeter; relative accuracy for these small times is better than absolute accuracy.)

User Avatar
Ze

 
Posts: 336
Joined: Tue Oct 21, 2008 2:50 am
Thanked: 61 times in 33 posts

Re: Vertical Ascent Rate

by Ze » Mon Nov 01, 2010 1:31 am

Hi Yury,

That's a good idea I'll get around to processing some data this week. Right now I'm running too many simulations for my "real" research. I do have lots of data, but maybe not enough at high altitude. Probably only 3 hikes above 12k feet (a lot more above 10k). I'm sure work rate will be lower at high altitude, but it will be interesting to see if we can see a trend without adjusting for other factors affecting my pace (terrain, hiking at other people's paces, etc...).

User Avatar
ExcitableBoy

 
Posts: 3666
Joined: Wed Nov 09, 2005 9:33 am
Thanked: 663 times in 496 posts

Re: Vertical Ascent Rate

by ExcitableBoy » Mon Nov 01, 2010 3:37 pm

Ze,

Love the blog, lots of really interesting information there. Thanks for sharing on this Web site. The graph seems to suggest that there is an asymptotic relationship of ascent rate vs grade. This gels with my personal experience. I seem to have the best rate of ascent when the grade is between 15 to 20 percent where I can do in excess of 4,000 ft/hr at elevations below 5,000ft.

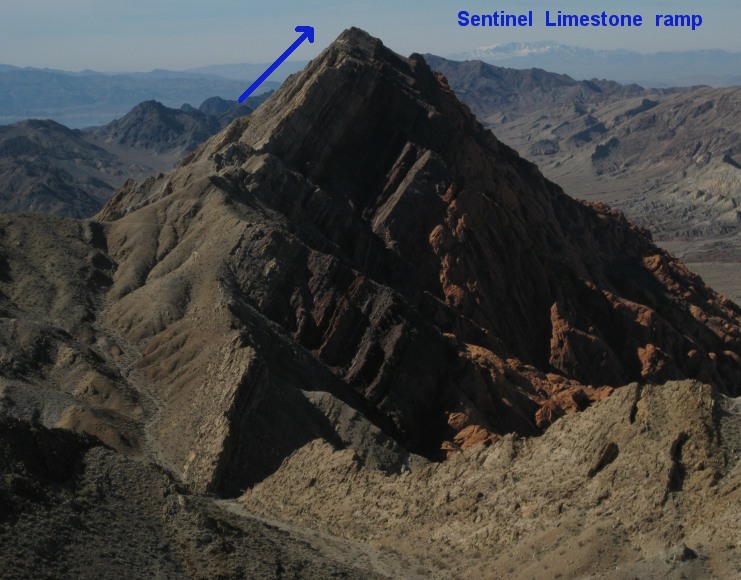
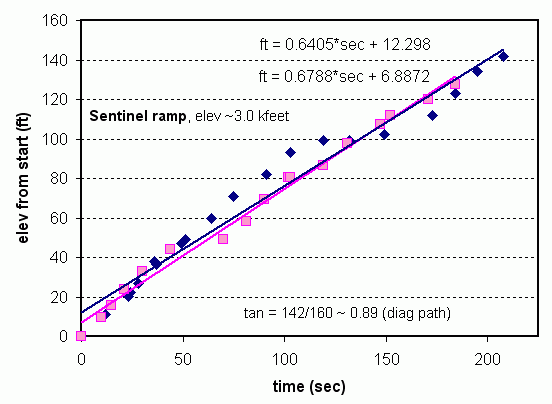
Ze wrote:What do you think happens when the grade gets close to 100%, and you're scrambling up?


On steeper ground I slow down considerably, for example I averaged only 1,800 ft per hour when climbing from Thumb Rock on Liberty Ridge to Liberty Cap. I would guess the average slope is around 45 degrees (giving a grade of 100 percent?) On Coleman Headwall on Mt Baker I slowed down to 1,000 ft per hour and the average slope was perhaps 55 or 60 degrees. Obviously there are other variables that affect the VAR such as altitude, wearing/carrying more weight, being carefull for fear of falling to one's death, etc.

Yury wrote:Do you have a similar plot of VAR vs. altitude?

This summer I have noticed that my VAR is significantly decreasing at higher elevation as compared to sea level. :(
Do you know whether somebody has calculated how severe is such decrease for other people?


As for the altitude component that Yury mentioned, I go from Paradise at 5,500 ft to Muir at 10,000 ft in 1:30 - an average grade of around 19% and a vertical ascent rate of ~3,000 ft/hr. About 25% slower than the VAR I can do at elevations below 5,000 ft. I think this is a pretty good comparison in that the largest variable is alittude - no heavy packs, no fear of falling, etc.

Take this data for what it is, anecdotal at best.

Edited for math errors.

Previous

Return to Technique and Training


  • Related topics
    Replies
    Views
    Last post

Who is online

Users browsing this forum: No registered users and 0 guests