


Proterra - Nov 26, 2008 2:39 pm - Hasn't voted
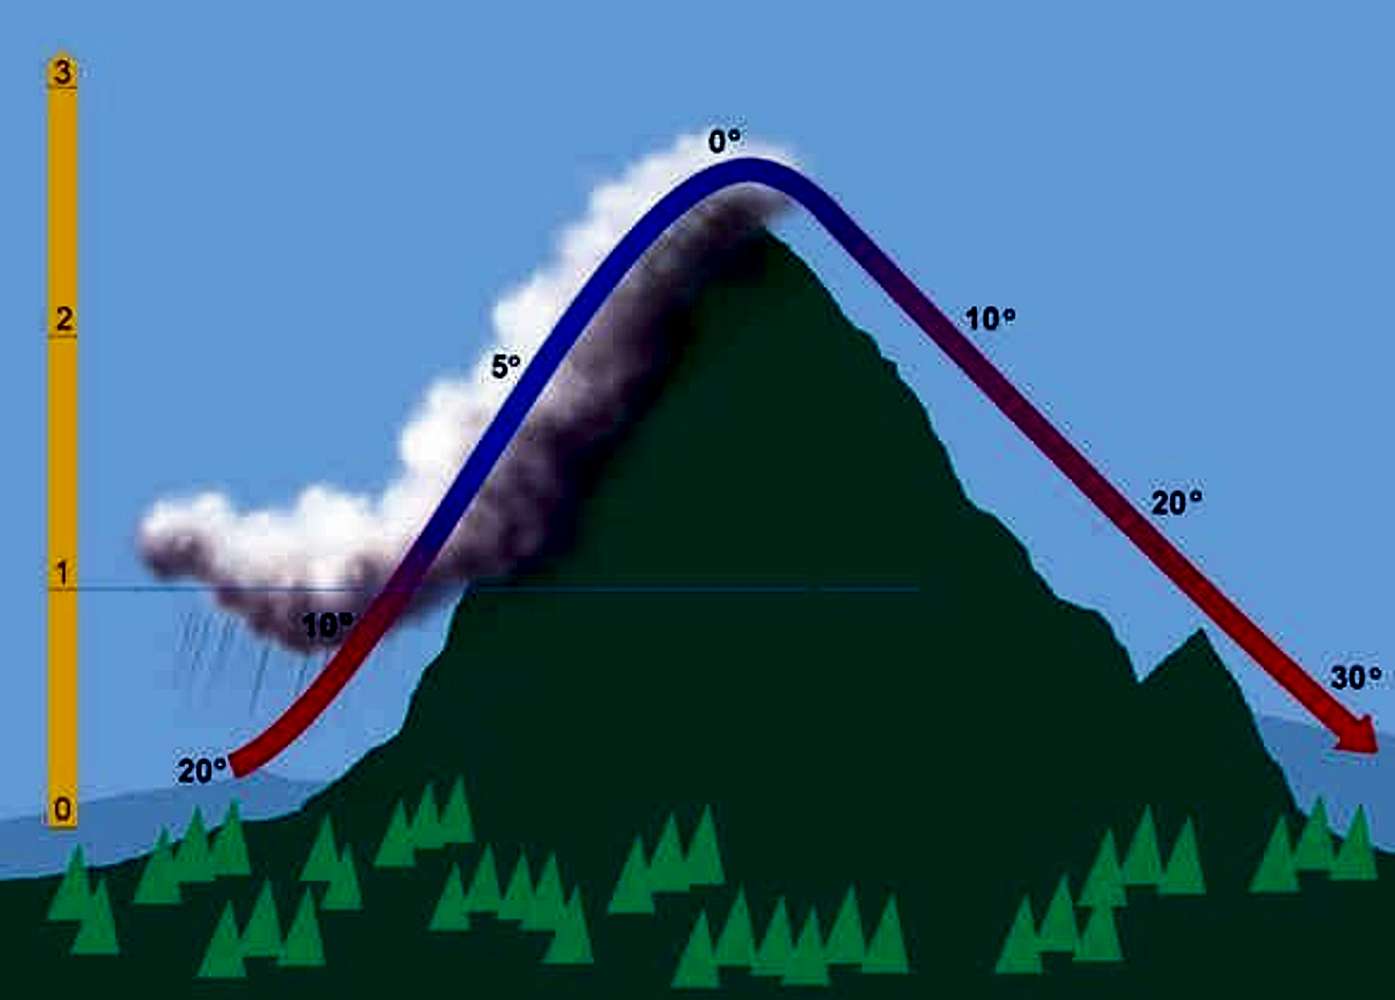
Explanation of what one sees hereAt the left side of the mountain, one sees an airmass coming in, with a temperature of 20C and a dewpoint of 12C. It starts rising dry-adiabatic up against the mountain (2C for DP, 10C for temp per 1000 metres) until it reaches it's saturation point at 1000 metres. Here it starts to rain, to allow the airmasses to shed excess moisture, forcing the dewpoint down, and it continues rising accoring to the moist adiabatic scheme, both dewpoint and temperature 5C/1000 metres until it reaches the summit at 3000 metres where both are at the freezing point. Freed from all it's excess moisture, the airmass races downhill dry adiabatic all the way, resulting in 30C temps and 6C dewpoints on the leeward side.
Windward: Temperature: 20C, Dewpoint: 12C, Relative Humidity: around 58%.
Leeward: Temperature: 30C, Dewpoint: 6C, Relative Humidity: around 22%.
 Cantal

Comments
Post a Comment