Mountaineering Accident Statistics

Mountaineering Accident Statistics

Page Type Page Type: Article

Introduction


The American Alpine Club annually publishes Accidents in American Mountaineering, which contains reports from various mountaineering accidents that occurred that year. The journal also includes statistical tables which summarize the number of mountaineering accidents, injuries, and fatalities, as well as interesting specifics such as terrain, immediate and contributing causes, ages and experience levels of individuals, month of year, type of injury, and location. I was fascinated by these statistical tables, but found the data hard to visualize. So, I spent a day creating pie charts and graphs from the 2007 Statistical Tables, which contain statistics on mountaineering accidents from 1951-2006 (click the above link to see the raw data for the 2007 statistical tables, which were the most recent I could find on the AAC website). The following page gives my graphical output of the statistical tables. I also draw a few inferences from the data.

Keep in mind that statistical studies involve some degree of personal interpretation/presentation, simplification of scenarios, and biased data, so all of my deductions should be taken with a grain of salt. Also keep in mind that a percentage of mountaineering accidents are never reported. Inherent to nearly all statistical data, the "missing data" issue tends to make absolute values a bit too low, but has little effect on percentages or relative comparisons.

My overall conclusion: For your best chances at experiencing a mountaineering accident, try climbing unroped or above your abilities on rocky terrain sometime between May-Sept in California or Washington.


"To reduce the chance of an accident, competent climbers develop a balanced relationship with fear, an awareness of danger, and turn their mental energy into positive means to overcome problems. Both instinct and acquired judgement are developed from experience. One learns about choices, when to push limits, where to avoid stonefall, where to belay, and when to turn back."

"Climbing is never wholly predictable, and from this uncertainty a richness may arise. It is important not to diminish the spirit of climbing and eliminate all risk. To reduce all commitment lessens the spirit and engagement of the adventure."

-Sage advice from the climbing great Fred Beckey, Fred Beckey's 100 Favorite North American Climbs


1951-2006 Mountaineering Accidents, Summary Graphs

Mountaineering Accidents, Injuries, Fatalities 1951-2006:
Injuries and Deaths per Accident, 1951-2006

Mountaineering Accident Details, 1951-2006 Averages

Primary Cause
Contributory Cause
Type of Injury
Terrain
Ascent/Descent
Experience Level
Age of Individuals
Month

Mountaineering Accidents by Location, 1951-2006 Averages

The statistical report contains a table listing the accidents by location. I took the opportunity to plot this data on cartograms, which are a great way of plotting geographical data in a way that highlights geographical trends. The following cartograms are broken down by decade to show how the number of accidents and fatalities has evolved over the last half-century. (If you are interested in cartograms, click here to go to my cartograms page that gives several more cool cartogram examples, as well as explains how they work, how I make them, and some background behind them.)

Some interesting trends in the pie charts and cartograms below:
  • Most mountaineering accidents occur in the rugged mountainous states of Washington, California, Wyoming, Colorado, and Alaska; of these states, Washington and California have the highest number of mountain accidents. A likely reason why these states have the most mountain accidents is because they not only have the greatest area of climbable terrain, but they also have a high number of "trophy" peaks (such as Denali, Rainier, Half Dome, etc.) which attract an outsized proportion of non-locals who are often overly eager to get to the summit.
  • Most mountaineering fatalities also occur in the five states mentioned above, with Washington and California having the highest numbers. In addition, Oregon also has a significant number of fatalities (even though it does not stand out as having as high a rate of accidents); these fatalities likely due to the fact that Mt. Hood seems to have a fair number of fatal accidents a year.
  • When normalized by state population, most mountaineering accidents per capita occur in Wyoming and Alaska. California in particular has a much smaller accident per capita rate than total accident rate.
  • When normalized by state population, most mountaineering fatalities per capita occur in Alaska and Wyoming. California in particular has a much smaller fatality per capita rate than total fatality rate.
  • The highest number of accidents and fatalities occurred in the 1970s and 1980s, especially in Washington and California. This was a time when new routes were being put up and new terrain was being explored.
  • Alaska has progressively had a greater percentage of the nation's mountaineering accidents and fatalities. This is likely due to an increase in Alaskan climbing as well as in increase in the proportion of accidents being better reported (although I still suspect a rather significant percentage of mountain accidents go unreported in Alaska compared to other states).
  • There has been a slight increase in the proportion of accidents that occur on the Atlantic-North coast over the years. This could indicate an increase in activities such as cragging, skiing, and ice climbing.
There are surely other interesting trends I have not mentioned. So feel free to study the following pie charts and cartograms and develop some more interpretations!

Note that this data does not allow a direct conclusion that one state is safer to climb in than another. For example, are there more accidents in Colorado than Alaska because there are factors that contribute to more accidents or are there just more people climbing? (Probably the answer is there are just more people climbing since the mountains are more accessible in Colorado than Alaska.) In order to make that type of comparison the number of person-hours climbing in each state must be factored in, rather than just using the total number of accidents/fatalities.


Total Reported Accidents by Location, 1951-2006 Averages - Pie Chart
Fatal Accidents by Location, 1951-2006 Averages, Pie Chart

Total Reported Accidents by Location, per 1,000,000 people in state, 1951-2006 Averages - Pie Chart

Fatal Accidents by Location, per 1,000,000 people in state, 1951-2006 Averages, Pie Chart


Total Reported Accidents by Location, 1951-2009 Data by Decade - Cartograms
1950s


-->
1960s


-->
1970s


-->


-->
1980s


-->
1990s


-->
2000s

Fatal Accidents by Location, 1951-2009 Data by Decade - Cartograms


1950s


-->
1960s


-->
1970s


-->


-->
1980s


-->
1990s


-->
2000s


Comparison with Traffic Accidents, 1990-2006 data

Although not covered in the statistical tables of the American Alpine Journal's Accidents in American Mountaineering, I was interested in how the frequency of mountaineering accidents compares with the frequency of traffic accidents.

I soon discovered that it is difficult to accurately compare climbing and driving. Climbing vs. driving would be most comparable if the number of accidents could be normalized by the hours spent climbing or driving (i.e. total person-hours/year driving and total person-hours/year climbing). However, this sort of hourly data is not readily available or easily estimated (I'd estimate that I spend more time in the mountains than in my car, whereas most climbers probably drive more than climb).

So I tried another normalizing method, which involved multiplying the climbing accidents by a factor which corresponds to the fraction of climbers in the population. Assuming everyone drives, but only 1 in 150 climbs (the Outdoor Industry Association estimates there are 2 million climbers in the US, which has a population of roughly 300,000,000), then multiplying mountaineering accidents by 150 would somewhat control for exposure. Technically, this technique assumes that the typical climber spends about as many hours driving as climbing, which is probably reasonable within a factor of 2. Even when the number of climbing accidents are multiplied by the normalizing factor of 150, the statistics suggest that the act of climbing is actually safer than the act of driving by a significant margin.

My conclusion, with however large a grain of salt you want to season it with: It's more likely a climber will get in an accident driving to or from the climb than on the climb itself.


Mountaineering Traffic Comments
Accidents reported per year 135
(x150 = 20250)
6,339,200 A climber is 313 (=6339200/20250) times more likely to get in a traffic accident than in a climbing accident.
Injuries per year 111
(x150 = 16650)
3,031,800 A climber is 182 (=3031800/16650) times more likely to get injured in a traffic accident than in a climbing accident.
Fatalities per year 28
(x150 = 4200)
42,880 A climber is 10 (=42880/4200) times more likely to die in a traffic accident than in a climbing accident.
(Note that this factor considers both accident frequency and fatality rate; hence, even though a climbing accident is more likely to cause a fatality than a traffic accident, because climbing accidents are less frequent, it is still more likely a person would die in traffic than climbing.)
Injuries per accident 0.82 0.48 Although mountaineering accidents are much less frequent than traffic accidents, they are 1.7 times more likely to cause injury than traffic accidents.
Fatalities per accident
0.21 0.01 Although mountaineering accidents are much less frequent than traffic accidents, they are 31 times more likely to cause fatalities than traffic accidents.
(Traffic data from US Census Bureau, Motor Vehicle Accidents and Fatalities, 1990-2006. Mountaineering data uses 1990-2006 AAC accident statistics for consistency.)

Below is a bar graph (sent to me by my friend Clint Cummins) showing the main causes of death in the US in 1988 for age 15-44, by sex. Motor vehicle accidents is the biggest cause of death for males. Mountain accidents would be included under "other accidents," a category which likely includes a fair amount of non-mountaineering accidents such as falling off ladders, crashing motorboats, housefires, etc. Altogether, "other accidents" have about the same death rate as suicide, diseases, cardiovascular, and cancer.

(Random notes: In higher age groups, cardio, rather than motor vehicle accidents, dominates. This bar graph was created out of 1988 data, when the AIDS death rate was higher than it is now.)

A note on conditional risk

The previous section used statistics to show that climbing accidents are relatively rare in the grand scheme of things. However, it is still important to be aware of the very real dangers in the mountains. Conditionally, mountaineering can be a risky undertaking (for example, it would probably be much more dangerous to go climbing on loose rock in poor weather than to drive down a residential street mid-morning). But, for some people, the risk adds to the fun and adventure of climbing.

Cartoon by Randall Munroe, found on XKCD.com.

Personal Accident Accounts

I've had the misfortune of being involved in two separate mountaineering accidents in Washington state. Both were caused by loose rock in rugged alpine terrain. In both cases, the climbing party was very experienced, and a series of good decisions resulted in a successful rescue. Click the links below to see the accident reports complete with photos.

Accident 1
In July 2009, my partner fell 60' and broke his femur and heel, requiring a shorthaul of the north buttress of Mt. Terror. This rescue was complicated by the fact that a second uninjured person in our party was stranded on the mountain for 4 more days when poor weather prevented him being able to be airlifted off when the helicopter returned.

Accident 2
In Sept 2010—ironically, only a week after I posted this article on accident statistics—I suffered a severe compound fracture of my tib/fib on the north face of Vesper Peak. This also required a helicopter rescue.


Mt. Rainier Climbing and Accident Statistics

I also have a separate statistical study on Mt. Rainier data, which looks at Mt. Rainier Accident and Fatality and Search-and-Rescue statistics, among other interesting data.


More on my website

This article is copied from my website, which has several other articles, climbing trip reports, and photographs from the North Cascades and elsewhere: www.stephabegg.com.

Comments

Post a Comment
Viewing: 21-40 of 47
mvs

mvs - Sep 13, 2010 2:47 am - Hasn't voted

Re: Surprising!

I think that is a really interesting paradox too. The experienced have become skilled at seeking out and staying on dangerous terrain for a greater percentage of the total trip time.

xpda

xpda - Sep 14, 2010 1:38 am - Hasn't voted

Re: Surprising!

The experienced people spend a lot more time per year climbing, on average, so the accident rate per hour should be quite a bit less than inexperienced people, despite the fact that the experienced ones are doing harder stuff.

LadyWawa

LadyWawa - Feb 9, 2011 11:59 pm - Voted 10/10

Re: Surprising!

This surprised me the most too! Fascinating article!

fossana

fossana - Sep 13, 2010 12:39 pm - Hasn't voted

good stuff

Thanks for putting this together. The other useful bit of data would be to normalize the data by # of participants. For example, are there more accidents in CO b/c there are factors that contribute to more accidents or are there just more people climbing? If you have age & experience data by stratified by state you could also do a multivariate analysis to weed out exactly which factors are contributing to morbidity & mortality per geo. I can help you set this up if you PM me.

StephAbegg

StephAbegg - Sep 14, 2010 12:44 am - Hasn't voted

Re: good stuff

I agree this would be fascinating. Ideally, I'd like to do a giant multivariable regression on this data. But the data is not specific or complete enough to do that, I don't think. The only state-by-state data provided is the total number of accidents (since 1951) and total number of fatalities (since 1951). It would be interesting to at least have some numbers on how big the climbing "population" is in each state, but I have not been able to find this data.....

fossana

fossana - Sep 30, 2010 7:47 pm - Hasn't voted

Re: good stuff

If I come across anything will let you know.

foweyman - Sep 14, 2010 7:45 am - Hasn't voted

unsupported conclusions

I appreciate your efforts to update your post based on peoples comments, but it still contains many non-factual, illogical, and misleading statements such as: "the statistics indicate that it's more likely you will get in an accident driving to or from the climb than on the climb itself. Hence, in this sense, climbing can be viewed as safer than driving!"

The presented statistics do not support this at all because there is no data presented on the amount of time spent driving to and from a climb and no data on time spent climbing. The only conclusion that can be made from the presented data is that more people die in car accidents than climbing accidents.

Similarly, the "comments" on the table about the relative safety of climbing and driving are misleading because they don't take into account that people spend far more time driving than climbing. By your logic jumping off the Empire State Building without a parachute is safer than driving because many more people die in driving accidents. Just because more people die from doing activity A than B does not mean that a person doing A is more likely to die than a person doing B.

I won't speculate on your motivation for drawing biased and misleading conclusions in order to understate the dangers of climbing, but the post would be more credible and meaningful if an objective approach were used and the limitations of the data were clearly stated.


vanman798

vanman798 - Sep 14, 2010 12:46 pm - Hasn't voted

Another point of view...

The author Maria Coffey states this in her book "Where the Mountain Casts Its Shadow: The Dark Side of Extreme Adventure"

"According to 2001 figures, in the United States approximately 41,000 people are killed every year in motor vechicle accidents, and 3 million more are injured. Out of a population of 272 million, that's approximately one death in 7,000. When I asked Steph Davies, who is thirty, how many of her friends have died in climbing accidents, she added eight. The American alpinist Mark Twight, who is in his early forties, says that forty-three people he knew have died climbing. Joe Simpson has lost, on average, a friend a year to the sport over the past fifteen years. How man people of their age have lost that many friends in automobile wrecks?"

Snidely Whiplash

Snidely Whiplash - Sep 14, 2010 6:23 pm - Voted 10/10

Fascinating subject

I love these kind of maps. What strikes me is how huge the fatality statistics are for the state of Washington, which outstrips every other state including California, which has a population about 5 times greater. As Bob Sihler already pointed out, beyond Rainier, Washington is not really a major destination for trophy climbing. Does this point to more hazardous snowpack conditions in Washington, or more dangerous weather?

CClaude

CClaude - Sep 16, 2010 10:56 am - Hasn't voted

also

Also years experience is a poor qualifier for experience. There are some people who have climbed 20 yrs but only a couple of times a year (or maybe once a week), but others who have climbed 2 years but 250days/year.

Also there are areas that chronically under report accidents, the Gunks in New York coming to mind.

StephAbegg

StephAbegg - Sep 19, 2010 3:37 pm - Hasn't voted

Re: also

I continue to welcome everyone's comments and am very happy to see that this article has generated a very intellectual and fascinating topic of discussion on summitpost. However, with school starting up for me I won't be able to keep the article up to date with comments, but please use this comments section to voice your interpretations an suggestions on improvement. Thanks1

nickmech

nickmech - Sep 19, 2010 8:46 pm - Hasn't voted

pie charts?

I must be in the minority here but pie charts are for nerds. I do find reading the AAC yearly report of great interest.

drjohnso1182

drjohnso1182 - Sep 20, 2010 11:21 pm - Hasn't voted
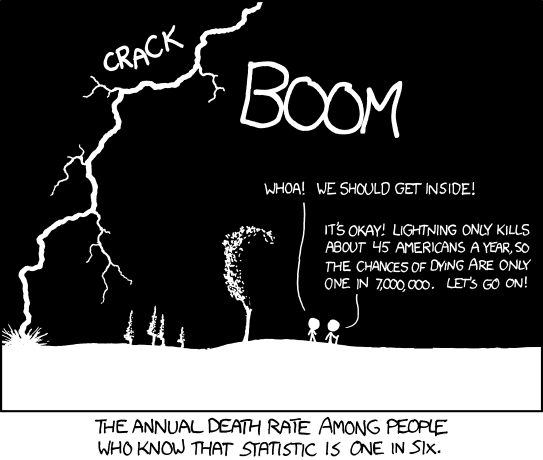
Conditional Risk

Today's xkcd comic is unusually appropriate:
http://xkcd.com/795/

StephAbegg

StephAbegg - Sep 21, 2010 12:25 am - Hasn't voted

Re: Conditional Risk

Love it! Sort of sums up the whole conditional risk issue we've been tossing around!

EastKing

EastKing - Sep 21, 2010 1:34 am - Voted 10/10

Awesome article.

Unfortunately I had read this after my injury. :)

Diggler

Diggler - Sep 28, 2010 1:25 pm - Voted 10/10

Interesting compilation

Whenever I get my annual issue of ANAM, I usually read it pretty continually until I'm finished- not only have I learned a great deal throughout the years using this resource (or so I like to think), it is fascinating (if morbid) reading material. It is a good idea to ponder the various primary & contributing reasons.

I think that it would be interesting to compare the per capita rates of accidents/fatalities on a state-by-state basis too- this could be enlightening (California, for example, has far more people than Washington & Colorado combined).

I think that it would also be worth noting the differences in accident locations. For instance,
- Denali vs. other climbing locations in Alaska- I would guess that the overwhelming majority of accidents in Alaska occur by visiting climbers, & even more specifically, on Denali itself. If one were to look at accidents outside of Denali, I'd surmise that there would be very few compared to other places.
- same thing on Hood, Rainier, etc. (big glaciated Cascade volcanoes)
- analyzing statistics by locations primarily frequented by visiting climbers (Denali, Rainier, Hood, etc.) vs. locations primarily climbed by 'locals.'

"Below is a bar graph (sent to me by my friend Clint Cummins) showing the main causes of death in the US in 1988 for age 15-44, by sex." I had no idea that anyone kept track of this data! I always thought that this would be the preferred way to go myself.

Thanks for putting this up- a good contribution.

Vinny

Vinny - Sep 29, 2010 5:08 pm - Hasn't voted

NORTH American Accidents

Nice work Steph!

my only criticism is you neglect the big part of north America including your beloved Valhallas.

It's an ongoing pet peeve for Canucks like me. You are not the first nor will you be the last. ; )

http://www.americanalpineclub.org/pt/accidentsinnorthamericanmountaineering

It would also be interesting to break down types of climbing into Sport/Trad crag/Alpine/altitude/glacier etc. The questions only become more complex.
I recall a statistical comparison between high altitude climbing and paragliding w.r.t. risk of fatality.

But yes, the majority of mountain rescues are hikers.

Heal well! Keep up the great exploits and journaling.
Kevin
EMRU/Providence

StephAbegg

StephAbegg - Sep 29, 2010 9:40 pm - Hasn't voted

Re: NORTH American Accidents

Main reason I did not include Canadian data in the location data is that I do not have a North American (US + CND) Shape file for making my cartograms..... =)

Ze

Ze - Oct 6, 2010 9:49 am - Hasn't voted

excellent page

what software do you use to make the cartograms?

StephAbegg

StephAbegg - Oct 6, 2010 10:48 pm - Hasn't voted

Re: excellent page

I used some java software made by Frank Hardisty, based on Gastner and Newman's algorithm:

http://people.cas.sc.edu/hardistf/cartograms/home.htm

Viewing: 21-40 of 47