
Viewing: 1-2 of 2

MoapaPk - Jan 14, 2008 11:09 am - Hasn't voted
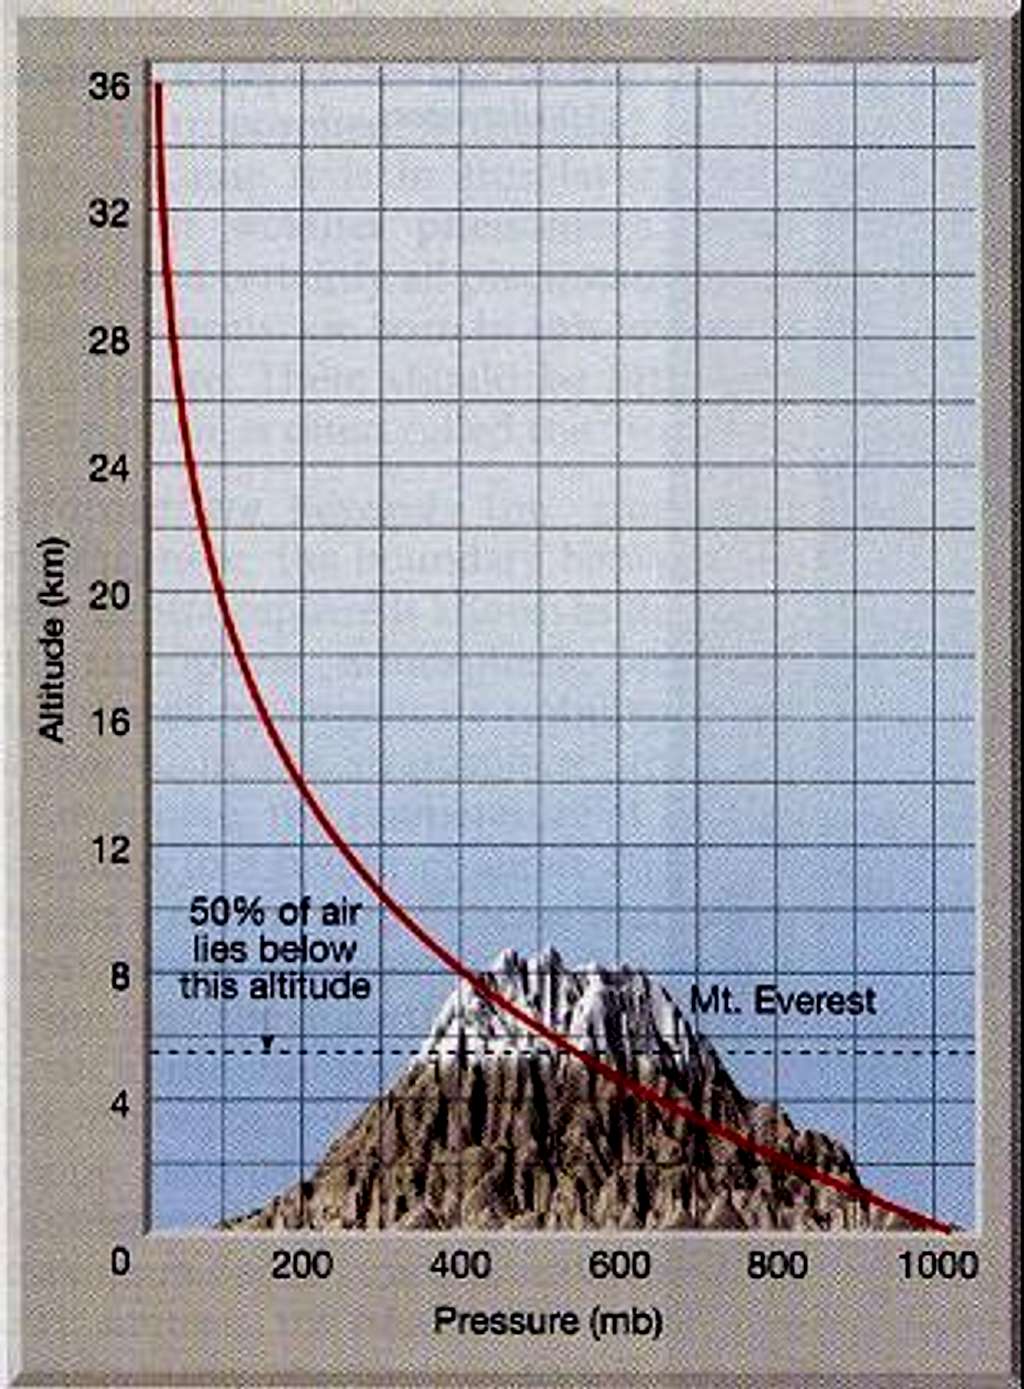
confusingThere should just be a single horizontal line for the altitude of Everest, with the corresponding vertical line to the mbar axis.

txmountaineer - Jan 14, 2008 2:30 pm - Hasn't voted
Re: confusingThanks for the comment! The graph is showing how pressure changes with altitude. Although the picture doesn't really look like Everest, the tip of the peak in the image corresponds with an elevation of ~8900m to approximate the pressure at the summit of Everest.
With this graph, anyone wanting to climb a 12,000m peak on earth can know to expect only about 150mb or pressure... ;-)
Thanks!
Daniel
Viewing: 1-2 of 2


Comments
Post a Comment