June 2008 - Graphs pulled from the
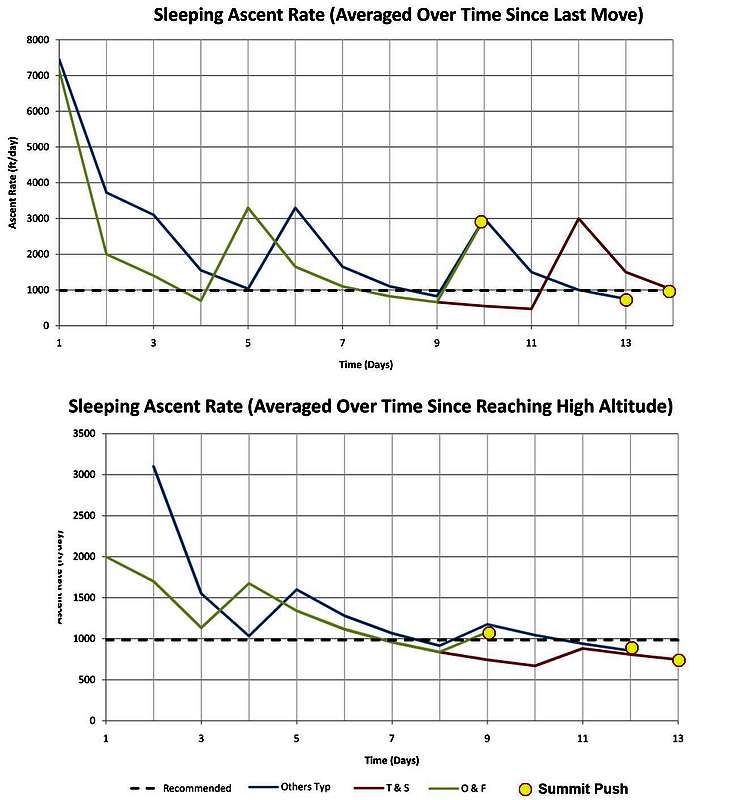
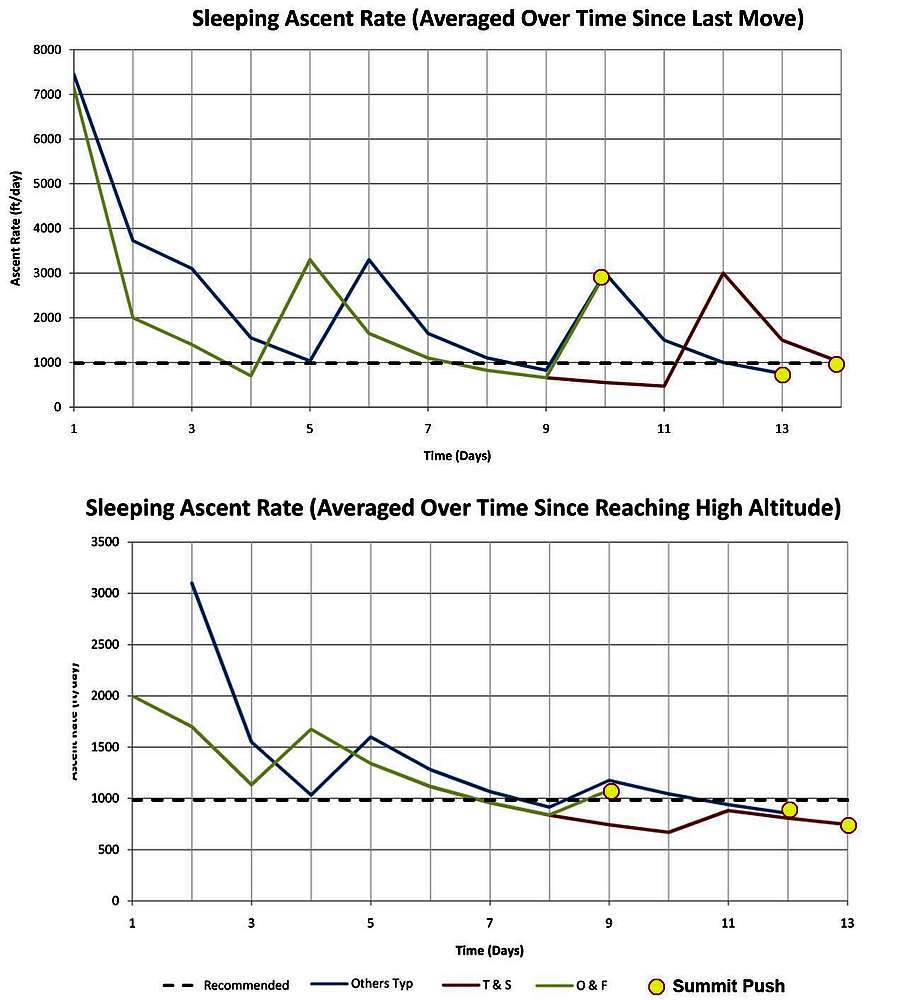
Ascent Profile Graph showing the average rate of ascent of the various parties. One graph is averaged over the time since the last move of sleeping elevation, and the other graph is averaged from the total time since reaching high altitude (10,000 ft).
Note that before each move and before the summit bid, each group waited until the average rate of ascent converged at the golden number of 1,000 ft per day.


